Article

High-Resolution Melting (HRM) Curve Assay for the Identification of Eight Fusarium Species Causing Ear Rot in Maize

1
Molecular Phytopathology and Mycotoxin Research, University of Goettingen, 37077 Goettingen, Germany
2
Centro para Investigaciones en Granos y Semillas, University of Costa Rica, 2060 San Jose, Costa Rica
3
Plant Pathology and Crop Protection, University of Goettingen, 37077 Goettingen, Germany
*
Authors to whom correspondence should be addressed.
Pathogens 2020, 9(4), 270; https://doi.org/10.3390/pathogens9040270
Submission received: 12 March 2020 / Revised: 3 April 2020 / Accepted: 5 April 2020 / Published: 7 April 2020
(This article belongs to the Section Plant Pathogens)

Abstract

:
Maize plants are often infected with fungal pathogens of the genus Fusarium. Taxonomic characterization of these species by microscopic examination of pure cultures or assignment to mating populations is time-consuming and requires specific expertise. Reliable taxonomic assignment may be strengthened by the analysis of DNA sequences. Species-specific PCR assays are available for most Fusarium pathogens, but the number of species that infect maize increases the labor and costs required for analysis. In this work, a diagnostic assay for major Fusarium pathogens of maize based on the analysis of melting curves of PCR amplicons was established. Short segments of genes RPB2 and TEF-1α, which have been widely used in molecular taxonomy of Fusarium, were amplified with universal primers in a real-time thermocycler and high-resolution melting (HRM) curves of the products were recorded. Among major Fusarium pathogens of maize ears, F. cerealis, F. culmorum, F. graminearum, F. equiseti, F. poae, F. temperatum, F. tricinctum, and F. verticillioides, all species except for the pair F. culmorum/F. graminearum could be distinguished by HRM analysis of a 304 bp segment of the RPB2 gene. The latter two species could be differentiated by HRM analysis of a 247 bp segment of the TEF-1α gene. The assay was validated with DNA extracted from pure cultures of fungal strains, successfully applied to total DNA extracted from infected maize ears and also to fungal mycelium that was added directly to the PCR master mix (“colony PCR”). HRM analysis thus offers a cost-efficient method suitable for the diagnosis of multiple fungal pathogens.

1. Introduction

Infection of crop plants with Fusarium spp. causes yield losses and leads to contamination of grains with mycotoxins [1]. Fusarium ear rot and ear mold are cosmopolitan diseases of maize, caused by Fusarium species producing secondary metabolites toxic to mammals, which are called mycotoxins. The most important mycotoxins found in maize grains are trichothecenes, zearalenone, and fumonisins. These contaminants impair grain quality and pose a risk to food safety [2,3]. Pre-harvest ear rot disease of maize is characterized by the appearance of white or reddish fungal mycelium with rotting symptoms on the cob. The disease is classified into two groups: Gibberella ear rot, also known as red ear rot, which is caused predominantly by F. graminearum, and Fusarium ear rot, also known as Fusarium ear mold and pink ear rot, which is caused by F. verticillioides. The most important infection route of maize cobs for both pathogens is colonization of silks [4,5], while F. verticillioides can also systemically colonize plants [6,7,8,9]. Other Fusarium species such as F. temperatum, F. subglutinans, F. poae, F. cerealis, F. tricinctum, and F. culmorum have also been reported to infect maize plants [10,11,12,13,14,15]. In the past decade, mycotoxins primarily known from maize and their producers have been reported also in other crops. The infection of wheat [16,17] and asparagus [18] with fumonisin-producing species of the Gibberella fujikuroi species complex is well established. Other species, not previously known to be infected by F. verticillioides in the field, such as rice and sugar beet, were shown to be susceptible to the pathogen when artificially infected [19]. In addition, weeds in maize fields were found to be heavily colonized by Fusarium spp., which are pathogenic on maize [20]. Residues of these plants might be the source of infection of maize in the next season. Infestation of the ears [21] and roots [22] of maize by herbivores facilitates infection by breaking mechanical barriers and disseminating inoculum. Due to the multiplicity of sources of inoculum and the complexity of factors affecting infection, the contamination of maize with Fusarium toxins is highly variable and difficult to predict [11,14].
Identification of Fusarium species can be achieved via a combination of phenotypic characterization (micro-/macromorphology) [23], assignment to mating populations [24,25], and analysis of selected gene loci [26,27,28]. Furthermore, production of specific secondary metabolites can support taxonomic assignments of Fusarium spp. [29,30,31]. Phenotypic traits alone are often not sufficient for taxonomical classification at the species level, especially regarding members of species complexes such as the F. fujikuroi species complex (FFSC) [13] or the F. oxysporum species complex (FOSC) [32]. Molecular tools are, therefore, widely used. Species-specific PCR primers [33,34,35] and real-time PCR assays [31,36,37,38,39] have been developed for all economically important Fusarium species. Previous studies have reported that sequencing of several marker genes, such as the RNA polymerase II second largest subunit (RPB2), translation elongation factor 1 alpha (TEF-1α), and beta-tubulin (β-TUB) [26,28,40,41], enables reliable distinction at the species level. However, only minor nucleotide variations or single nucleotide polymorphisms (SNPs) may distinguish between closely related species, as was observed for the differentiation of F. temperatum from F. subglutinans [13]. Therefore, for robust taxonomical classification, the use of additional marker genes is recommended.
Species-specific PCR assays are available for all economically relevant Fusarium species, but carrying out numerous assays for each sample multiplies the costs. Multiplexing reduces the costs of polymerase and nucleotides (not the costs of primers), but it adds the need to separate the signals. Electrophoretic separation of PCR products is not scalable; therefore, fluorescence-based species-specific detection is used, but minisequencing [27] and double-labeled hybridization probes [36] significantly increase the costs of such assays.
Melting curve analysis is a closed-tube technique for the characterization of genetic variation in DNA amplicons based on the dissociation of double-stranded DNA with increasing temperature [42]. The amount of double-stranded DNA in each step is determined by the fluorescence of DNA-intercalating dye. High-resolution melting (HRM) curves generated with small temperature increments (commonly 0.1–0.2 °C) allow DNA fragments differing by as little as a single nucleotide to be distinguished. The entire analysis is carried out in the real-time PCR thermocycler that was used for the amplification. SYBR Green® is the standard dye used in real-time PCR, but EvaGreen® is used instead in melting curve analysis because it binds to all DNA base pairs [43]. Melting curves reflect not just GC composition, but also the sequence of the amplicon, and can therefore differentiate among amplicons with identical GC content. The analysis of DNA melting curves has successfully been applied in clinical medicine [44], virology [45], and in the identification of plants [46], insects [47], and phytopathogenic fungi [48,49].
In the present study, the suitability of melting curve analysis of short variable subsections of RPB2 and TEF-1α genes for the differentiation of eight major Fusarium pathogens infecting maize ears in Germany [50] was established.

2. Results

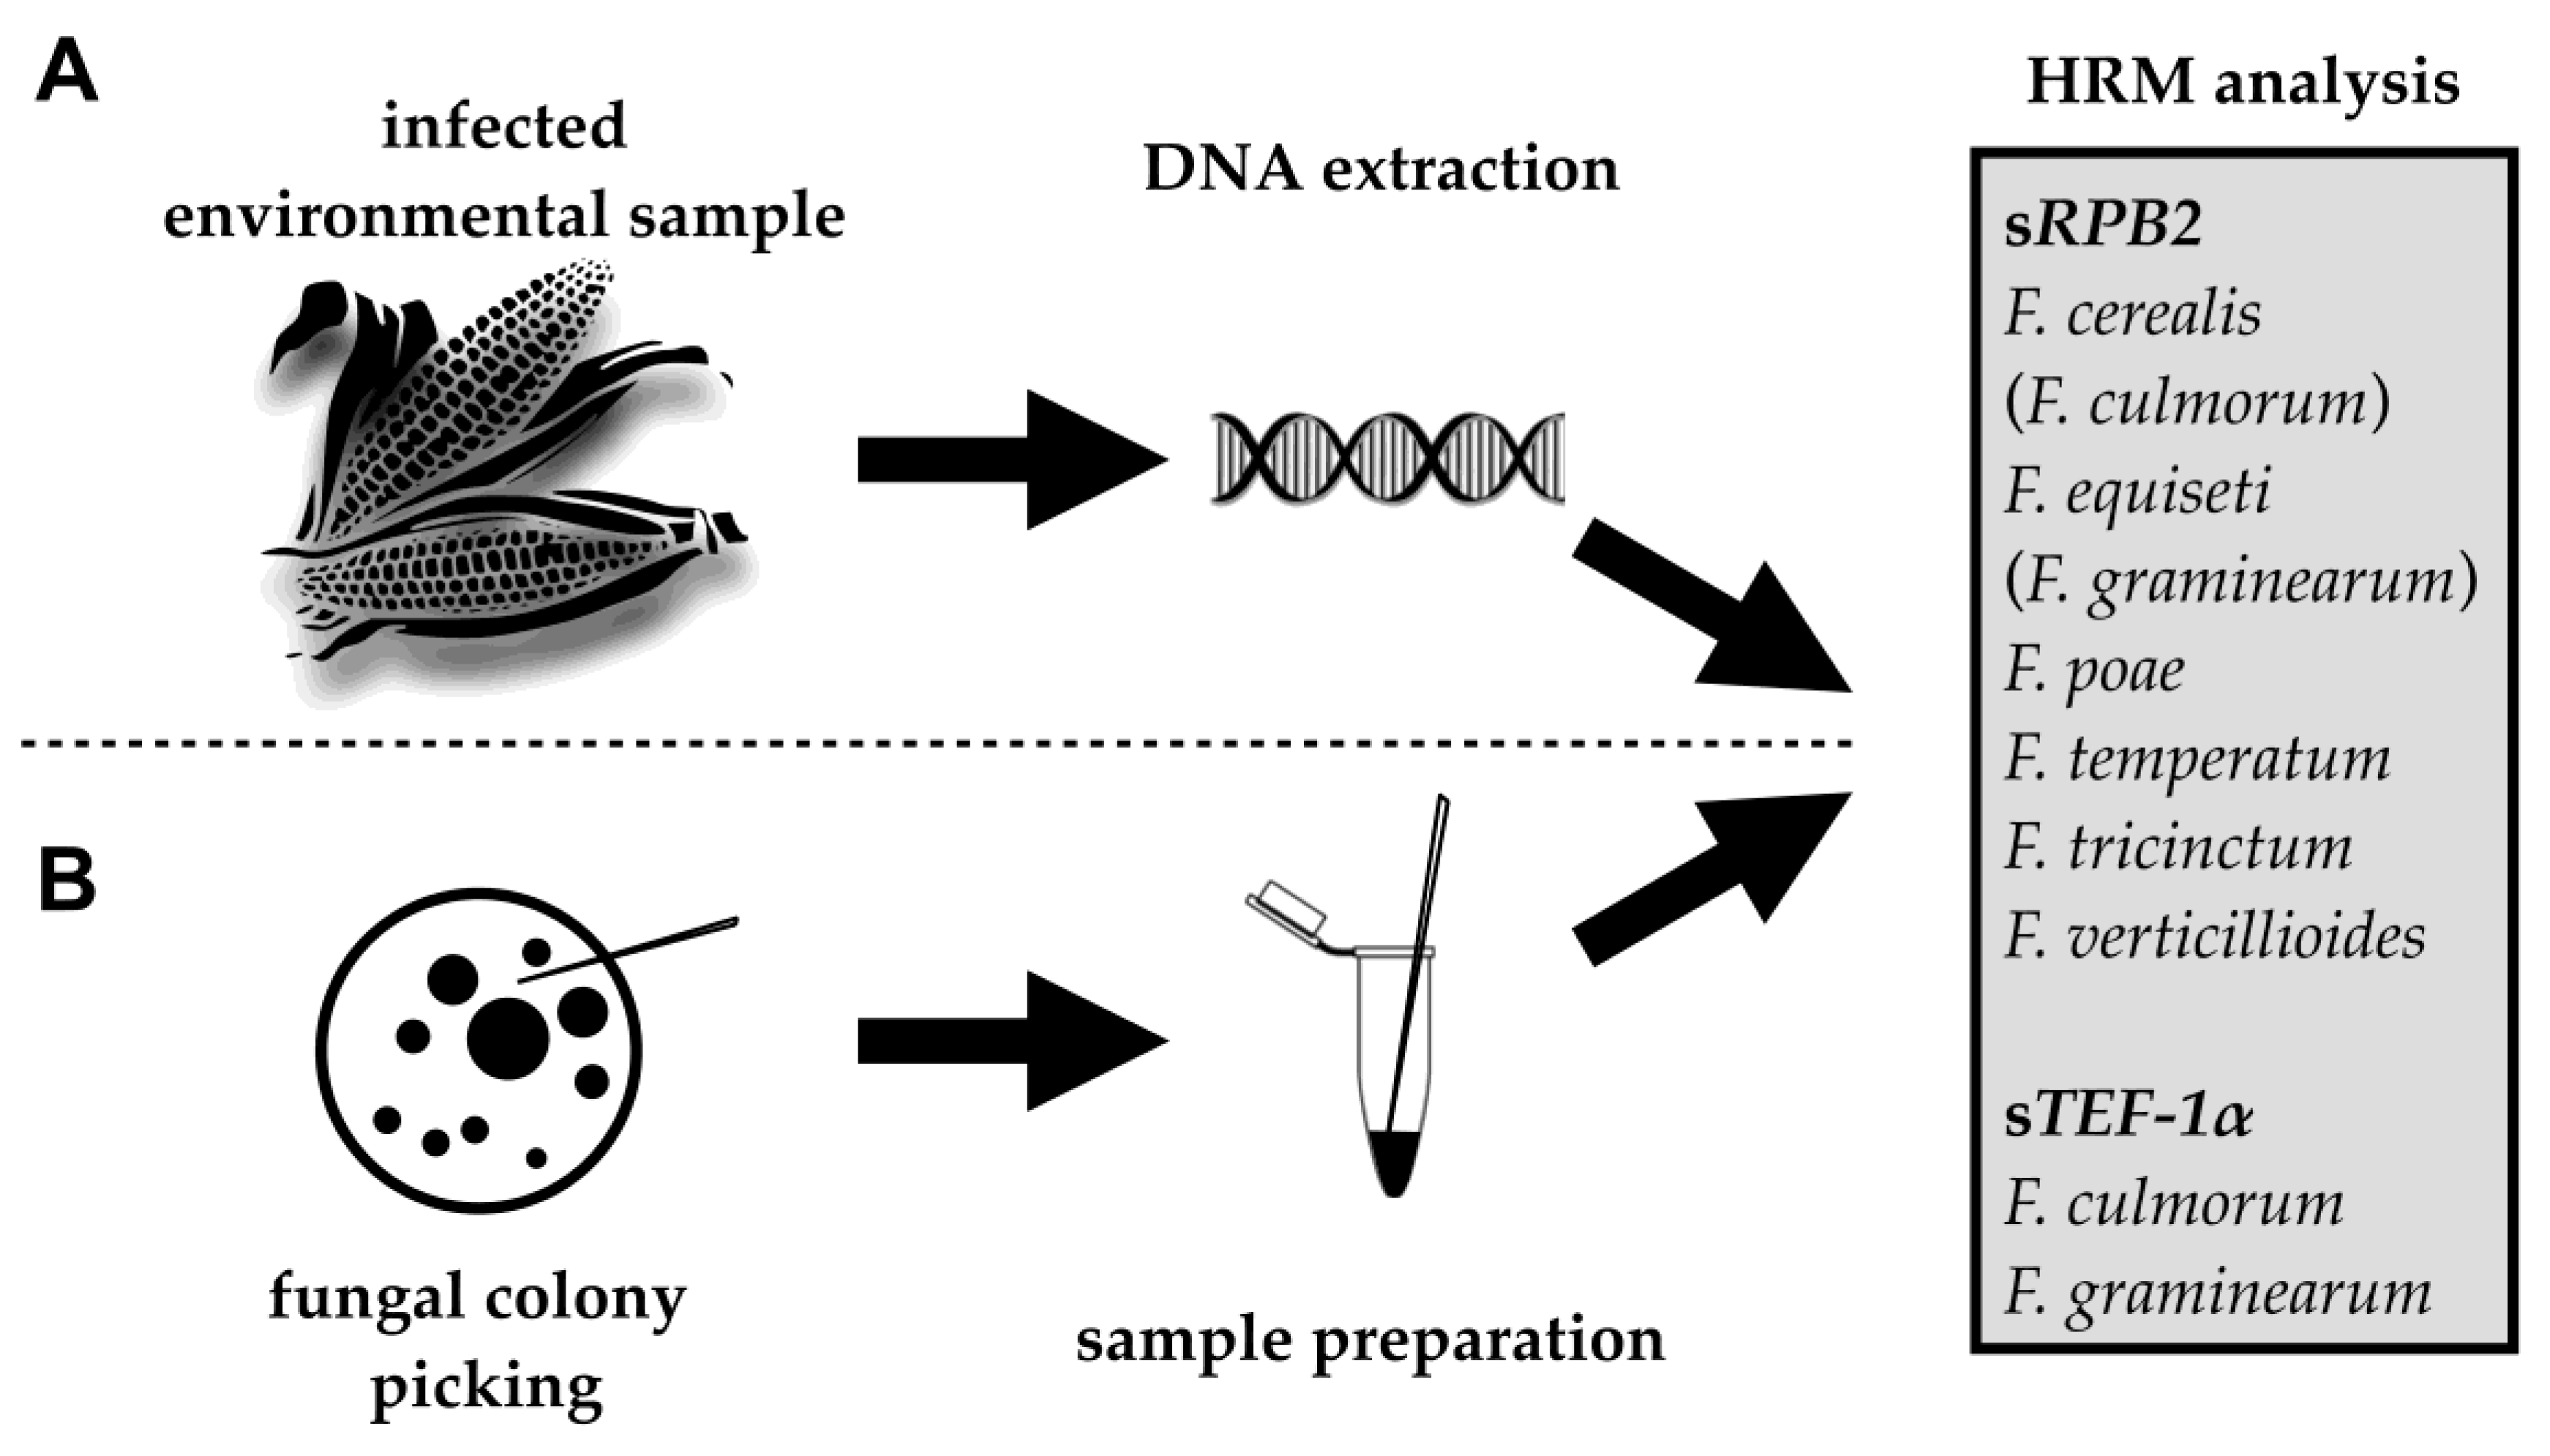
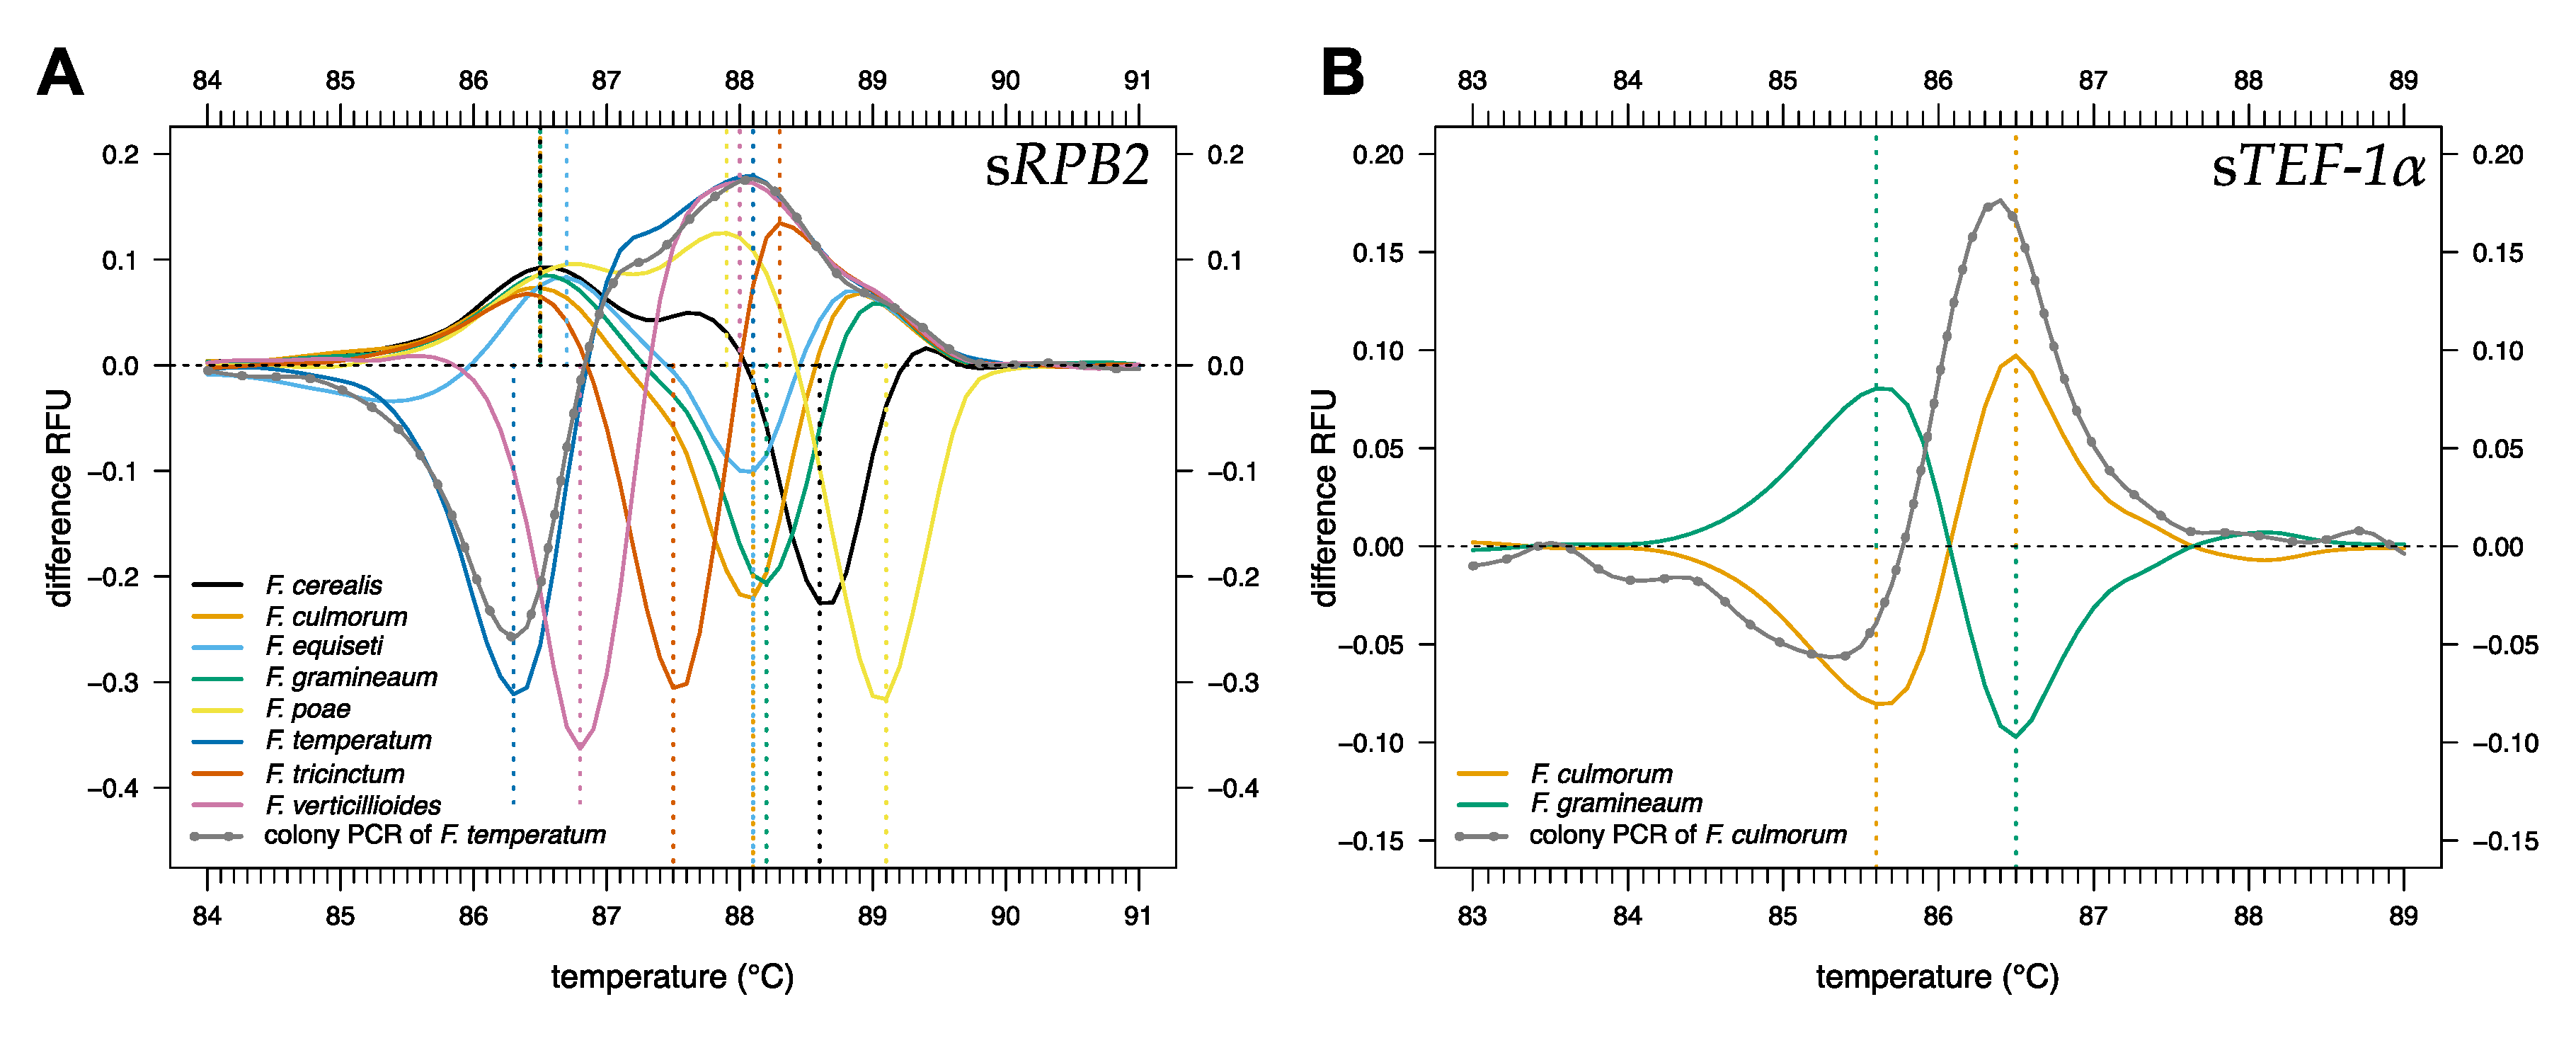
2.1. HRM Analysis of sRPB2 and sTEF-1α for the Identification of Fusarium Species

Primers commonly used for the amplification of RPB2 and TEF-1α in taxonomy amplify fragments that are too long for HRM analysis. Therefore, new primers were developed for the identification of eight major Fusarium species that cause ear rot in maize, namely F. cerealis, F. culmorum, F. graminearum, F. equiseti, F. poae, F. temperatum, F. tricinctum, and F. verticillioides, via HRM analysis (Table 1, Figure S1). Taxonomically characterized reference strains were used as standards (Table S1). Short variable segments of RPB2 and TEF-1α genes, which we refer to herein as sRPB2 (shortRPB2, 304 bp) and sTEF-1α (shortTEF-1α, 247 bp), respectively (Table 1), were used. sRPB2 reliably distinguished F. cerealis, F. equiseti, F. poae, F. temperatum, F. tricinctum, and F. verticillioides (Figure 1, Figure 2C,E). The melting curves allowed secure discrimination of DNA of these pathogens extracted from pure culture as well as from naturally infected maize ears. sRPB2 amplicons of F. culmorum and F. equiseti had similar melting temperatures but could be distinguished with an additional melting domain of the amplicon of F. equiseti, which caused a shoulder in the melting curve (Figure 2C). The differentiation between F. culmorum and F. graminearum was more difficult, due to highly similar melting curves. However, the melting curves of the sTEF-1α fragment allowed reliable differentiation between F. culmorum and F. graminearum DNA extracted from pure cultures as well as from infected maize cobs (Figure 2D,F). Therefore, HRM for the sTEF-1α fragment was included in the assay. Both sRPB2 and sTEF-1α were amplified using identical PCR conditions. The simultaneous amplification within the same PCR run enabled the identification of all eight tested Fusarium species in a single HRM analysis (Figure 2C–F).
Melting temperatures of PCR products of the reference strains are listed in Table S2. The GC content ranged from 49 to 54% for sRPB2 and 49 to 50% for sTEF-1α (Table S2, Figure S1). No primer dimers or unspecific products were observed for the reference strains. Nucleotide sequences obtained for both sRPB2 and sTEF-1α showed high similarity (≥ 85%) across the reference strains (Figure 2A,B, Figure S1). In total, 73 SNPs were found in sRPB2 and 4 SNPs in sTEF-1α (Figure S1). Nucleotide polymorphisms were relatively evenly distributed across the length of sRPB2 (Figure S1A), but clustered in sTEF-1α (Figure S1B). Comparing the number of DNA polymorphisms with the melting curves, we concluded that the minimum number of nucleotide differences sufficient for differentiation between two Fusarium species by melting curve analysis was four. In the reference strains of F. graminearum and F. culmorum, these differences occurred at nucleotide positions 102, 158, 188, and 190 of sTEF-1α (Figure S1B). In sRPB2, only two distant nucleotide positions differed between the reference strains of these species (nucleotide positions 104 and 275). Based on sRPB2, no reliable separation of F. graminearum and F. culmorum by HRM was possible. A maximum number of 46 SNPs were observed in sRPB2 sequences of the reference strains for F. temperatum and F. poae (Figure S1A).
The specificity of the assay was assessed by determining the melting temperatures of sRPB2 and sTEF-1α amplicons for an additional 12 Fusarium species (Table S4). Except for four species, melting temperatures of sRPB2 amplicons differed from the melting temperatures of sRPB2 of all target species (Table S2) by more than 0.15 °C. Only F. redolens, F. proliferatum, F. fujikuroi, and F. avenaceum could not be differentiated from some of the target species by the melting temperature of sRPB2. The amplification of sTEF-1α failed for F. redolens and F. avenaceum (Table S4), distinguishing them from the target species. F. proliferatum and F. fujikuroi could not be distinguised from F. temperatum by melting temperatures of sRPB2 or sTEF-1α amplicons; it has to be noted that F. fujikuroi does not infect maize.
Both amplicons, used to generate melting curves, were generated with primer pairs consisting of a well-established primer (RPB2-5F2 and EF1αR) and a new primer designed for this study (RPB2-5R1s and TEF-1aFs2). The presence of binding sites for the established primers in all Fusarium spp. has been documented in numerous studies but the robustness of the newly designed primers was unknown. Nucleotide variation in binding sites might lead to a failure of the method with field isolates. To assess primer binding to DNA from other strains, 64 sequences of RPB2 or TEF-1α from isolates of target species were retrieved and aligned with the sequences of newly designed primers. Not a single mismatch was found; the list of the sequences is provided in Table S5. Regarding F. graminearum Schwabe, many genetic lineages of this traditional species have been defined as species, although the boundaries of the new species are incongruent with the biological species concept and remain controversial [23]. To check for binding of newly designed primers to target sequences from these lineages, we retrieved 28 sequences of RPB2 and TEF-1α from members of seven phylogenetic lineages of F. graminearum sensu lato. Aligning the sequences with primers RPB2-5R1s or TEF-1aFs2 did not reveal any mismatch (Table S6).

2.2. Identification of Fusarium Species in Naturally Infected Maize Ears

The HRM assay was evaluated by screening DNA samples extracted from 100 maize ears naturally infected with Fusarium spp. (Figure 1A), which were sampled from across Germany (Figure S2). Morphological examination of fungal strains isolated from these ears prior to DNA extraction revealed that most ears were infected with several Fusarium species. HRM analysis successfully identified the most abundant Fusarium species in 80% of the ears (Table S3). The majority of maize ears (62%) were infected with F. graminearum, followed by F. verticillioides (10%), F. temperatum (6%), and F. poae (2%).

2.3. Fungal Colony PCR

All eight reference strains of Fusarium were successfully identified via HRM analysis after colony PCR (Figure 3). Boiling a small piece of mycelium picked from an agar plate for 10 min in 100 μL H2O released sufficient amounts of DNA for amplification. The use of larger amounts of mycelium for DNA preparation by boiling occasionally led to the inhibition of PCR; thus, a very small piece of mycelium (just visible by the naked eye) was sufficient. The inhibition of PCR by mycelial extracts was particularly pronounced for F. poae: Extracts of 100 µg mycelium (dry weight) boiled in 100 µL water always inhibited PCR, while extracts of 10 µg mycelium reliably generated the desired amplicons.

3. Discussion

Analysis of melting curves of PCR products has been used previously to diagnose pathogens [51,52], including a duplex assay for two Fusarium species [37] and intraspecific differentiation within a Fusarium species complex [49]. In this work, the analysis of melting curves of PCR amplicons was exploited for the development of a multiplex diagnostic assay. Fusarium species commonly infecting maize ears in Germany [50] were selected for the implementation of the concept, but disease diagnosis in many crops faces the same challenge: numerous pathogens can infect the crop, though only a single pathogen or a few pathogens are typically found in each sample. For instance, many Fusarium pathogens can be isolated from ears of small grain cereals afflicted with Fusarium Head Blight [53]. To overcome the limit of multiplexing species-specific PCR, detection of PCR products by hybridization to an array of DNA targets has been suggested. The concept has been successfully implemented for several systems, including the differentiation among members of the Fusarium solani species complex of pathogens of solanaceous plants [54] and identification of numerous Pythium spp. [55]. Detection by hybridization allows high-level multiplexing, but the specificity of hybridization is lower than the specificity of PCR or melting curve analysis; careful optimization of hybridization conditions is required to prevent the hybridization of DNA of a single pathogen with several targets. A powerful PCR-based diagnostic system with high-level multiplexing and quantitative detection has been developed by BioTrove [56]. The method requires a complex proprietary instrumentation, which seems to no longer be available since the acquisition of BioTrove by Life Technologies in 2009 and the acquisition of Life Technologies by Thermo Fisher in 2014.
Among the molecular sequences used in Fusarium taxonomy, RPB2 and TEF-1α have been used most frequently [57,58]. The distinction between similar sequences by HRM relies on differences in GC content, amplicon length, and the sequence [44]. In order to maximize the specificity of HRM analysis, short and highly polymorphic regions are used as amplicons [45,49,50]. The sequences of RPB2 and TEF-1α genes used in the molecular taxonomy of Fusarium are too long for HRM; therefore, segments of the genes flanked by an established primer on one end and a new primer on the other end were amplified (Table 1). The location of both primers in highly conserved regions reduces the chance that the assay may fail for new isolates because of the lack of primer binding.
The assay fulfilled the purpose of detecting and distinguishing all eight major Fusarium pathogens infecting maize ears in Germany. DNA from some minor pathogens or saprophytes might generate indistinguishable melting curves, causing false positive signals. Due to their low abundance, however, the impact of these false positives on decisions about crop protection is expected to be negligible. To assess the specificity of the assay, melting temperatures of sRPB2 and sTEF-1α amplicons were determined for an additional 12 Fusarium species (Table S4). Only F. fujikuroi and F. proliferatum could not be differentiated from the target species. F. fujikuroi does not colonize maize. F. proliferatum infects maize in some growing areas [5,11,12,15], but recent studies reported the species to be at a low abundance on maize in Poland [14], and essentially missing from maize in Germany [50]. Because the melting curves of sRPB2 and sTEF-1α cannot distinguish between F. proliferatum and F. temperatum, an additional amplicon would be needed for the extension of the assay to F. proliferatum.
In addition to the identification of eight Fusarium species by HRM analysis of sRPB2 and sTEF-1α amplicons, the assay proved suitable for the identification of dominant pathogens in DNA extracted from naturally infected maize ears and for the identification of fungal colonies without DNA extraction by HRM followed by colony PCR. This shows that the technique is sufficiently robust to be used in routine diagnosis. Two of the eight species could not be discriminated by HRM analysis of a single amplicon, but were reliably distinguished by the melting profiles of another amplicon. An extension of the assay to further Fusarium species may require the integration of further amplicons, which could originate from the same gene or from other genes. The relatively high level of multiplexing and the simplicity of HRM assays, which work with universal primers and consist of a single run on a real-time thermocycler without further sample processing, truly compensates for the need to integrate additional amplicons with growing numbers of target species. The costs of HRM assays are lower than the costs of multiplex PCR with species-specific primers, TaqMan probes, hybridization of PCR products to immobilized species-specific targets, or DNA sequencing, let alone advanced technologies such as BioTrove’s OpenArray.
Field samples are often infected with multiple pathogens. The fact that our HRM assay is based on PCR primers that amplify DNA from multiple Fusarium species leads to two potential problems. First, amplicons in DNA extracted from samples infected with multiple pathogens will compete for primers, nucleotides, and DNA polymerase. The amplification of abundant pathogens may thus suppress the amplification of minor pathogens, preventing their detection. For the use of the assay in crop production, this does not pose a problem, because plant protection focuses on major pathogens. The second issue is that co-amplification of multiple amplicons may lead to the formation of hybrids, which melt at lower temperatures than the parent molecules. The presence of hybrids in amplification products will complicate the HRM patterns. Whether, and to what extent these hybrids may interfere with the assignment of amplicons/curves to taxa has to be further investigated. In the analysis of 100 naturally infected maize ears reported here, melting curves of hybrid amplicons were not detected. We suggest that this can be accounted for by the unequal abundance of pathogens in ears with mixed infection. Extrapolating the frequency of detection of dominant pathogens (see Section 2.2) to mixed infections, 6% of ears were likely infected concomitantly with the two most dominant pathogens, F. graminearum and F. verticillioides. If the abundance of pathogens in the infected ears was unequal, the melting curve of the less abundant pathogen and the melting curves of hybrid amplicons likely escaped detection. This will not pose a problem when the assay is used to guide crop protection against major pathogens.
In monitoring programs that include isolation of fungal strains, melting curve analysis of amplicons generated by colony PCR might be used to identify minor pathogens or resolve ambiguous results of melting curve analysis of samples with mixed infection. The advantage of this approach is that the same technique is used for both the original analysis and the follow-up analysis of problematic samples. If melting curves are used in a routine diagnostic pipeline, the products of colony PCR can simply be inserted into the pipeline to be analyzed with the next sample batch.

4. Material and Methods

4.1. Reference Strains, Sample Collection, and DNA Extraction

We selected eight Fusarium species (F. cerealis, F. culmorum, F. equiseti, F. graminearum, F. poae, F. temperatum, F. tricinctum, and F. verticillioides) for identification via HRM analysis. For each species, a reference strain (Table S1) was cultivated on potato dextrose agar plates for 5 to 7 days at 25 °C in the dark. For the comparison of melting temperature of amplicons, strains of 12 additional Fusarium spp. (Table S4) were grown in the same way. Mycelium was carefully scrubbed from the surface of the plates and lyophilized. In addition to reference strains, 100 naturally Fusarium-infected ears were collected from silage and grain maize, harvested at 30 field sites (one to nine ears per site) in seven federal states across Germany in 2017 (Figure S2). Ears were crushed, lyophilized, and finely ground to 1 mm using an ultra-centrifugal mill (ZM 200, Retsch, Haan, Germany). DNA from 30 mg naturally infected maize ears, as well as lyophilized mycelium of the reference strains, was extracted using a cetyltrimethylammonium bromide (CTAB)-based protocol [37]. Quality and quantity of the extracted DNA were assessed on agarose gels (0.8% (w/v) in 1 × Tris-acetate-EDTA buffer) stained with ethidium bromide. Gel electrophoresis was carried out for 60 min at 4.6 V/cm.

4.2. Fungal Colony PCR

Reference strains of Fusarium were cultivated as described above (see Section 4.1.), and aerial mycelium was carefully scrubbed from the surface of the plates using sterilized toothpicks and placed into a 1.5 mL tube containing 100 μL double-distilled water (ddH2O). For F. cerealis, F. culmorum, F. graminearum, F. equiseti, F. temperatum, F. tricinctum, and F. verticillioides, the mixture was incubated at 100 °C for 10 min and subsequently centrifuged at 16,000 × g for 30 s to pellet the mycelium. The obtained supernatant was transferred into a new 1.5 mL tube and directly used for PCR. For F. poae, the mycelium was briefly (approximately 10 s) introduced to the ddH2O. The mycelium was largely removed using the toothpick and colony PCR was performed from the remaining ddH2O without any further processing.

4.3. Primer Design and Maximum Likelihood Tree Analysis

We selected the RPB2 and TEF-1α region for HRM analysis. In order to design primers flanking short and variable subsections of RPB2 and TEF-1α, we first amplified both regions for the eight reference strains of Fusarium (Table S1), as described by Lofgren et al. [59] for RPB2 and O’Donnell et al. [60] for TEF-1α. PCR products were purified and sent to Macrogen Europe for Sanger sequencing (Macrogen Europe B.V., Amsterdam, the Netherlands). The results were evaluated with Chromas version 2.6.6 (Technelysium Pty Ltd, South Brisbane, Australia). Multiple sequence alignment was then performed using ClustalW [61] in MEGA version 7.0.26 [62]. Alignments were processed in T-Coffee version 11.00y [63] and ESPript version 3.0 [64] (Figure S1). Two new primers suitable for HRM analysis were designed based on multiple gene alignments using the sequences of our eight reference strains (Table 1). Primer binding sites were conserved among species. We hereinafter refer to the selected subsections as sRPB2 and sTEF-1α. The amplicon length was 304 bp for sRPB2 and 247 bp for sTEF-1α (Table 1). Finally, a maximum likelihood analysis was conducted for sRPB2 (1000 bootstrap replications) and sTEF-1α (without bootstrapping due to low sample size (n = 3)) using MEGA 7.0.26.

4.4. HRM Analysis

PCR conditions were optimized using gradients of annealing temperature and final MgCl2 concentration. Amplification was performed in a CFX384 Thermocycler (Biorad, Rüdigheim, Germany) in 384 well microplates (SARSTEDT AG & Co. KG, Nümbrecht, Germany) with a total reaction volume of 4 μL. Reaction mixtures were composed of 1 μL template DNA or ddH2O for negative controls and 3 μL of reaction mixture (reaction buffer (20 mM Tris-HCl, 10 mM (NH4)2SO4, 10 mM KCl, 2 mM MgSO4, 0.1% Triton® X-100, pH 8.8 at 25 °C); 0.5 mM MgCl2, 200 µM of each deoxyribonucleoside triphosphate (Bioline, Luckenwalde, Germany), 0.3 µM of each forward and reverse primer (Table 1); 3.3-time diluted EvaGreen® solution (Jena Bioscience, Jena, Germany); 1 mg/mL bovine serum albumin, and 0.03 U Taq DNA Polymerase (New England Biolabs, Beverly, MA, USA)). Template DNA of the reference strains was adjusted to 100 pg μL−1 in ddH2O using gel densitometry [31]. DNA from naturally infected maize ears was diluted 1:100 in ddH2O before use in PCR. For fungal colony PCR, DNA was obtained as described in Section 4.2. Thermocycling conditions were as follows: 95 °C for 2 min (initial denaturation), 30 cycles of 94 °C for 30 s, 57 °C for 30 s, and 68 °C for 30 s. Final elongation was performed at 68 °C for 5 min. Following this, samples were heated to 95 °C for 30 s and cooled to 55 °C for 60 s. For fungal colony PCR, 35 cycles were performed. Fluorescence data for HRM analysis was obtained by increasing the temperature step-wise from 65 to 95 °C at 0.1 °C for 5 s per step with continuous fluorescence measurement. Reference strains of Fusarium species and negative controls (ddH2O) were amplified in triplicate.

4.5. Fluorescence Data Processing and Taxonomic Assignment

Relative fluorescence unit (RFU) data were obtained from CFX Maestro™ Software (Bio-Rad CFX Maestro 1.1 version 4.1.2433.1219) Biorad, Rüdigheim, Germany and analyzed in the R environment (version 3.6.1) [65]. RFU data were normalized by scaling all RFU values of each sample between 0 and 1. The negative first derivative (-d(RFU)/d(T)) was calculated employing the “diffQ2”-function in the R-package “MBmca” (version 0.0.3-5) and plotted to obtain normalized melting curves. The melting curves of the reference strains were generated from the mean fluorescence of the three technical replicates. Difference curves were obtained by subtracting the melting curve data of each reference strain or environmental sample from the mean melting curve data of all reference strains. Taxonomic identification was performed manually by carefully comparing the difference curves of the environmental samples against the reference strains.

5. Conclusions

Analysis of high-resolution melting (HRM) curves for the identification of Fusarium pathogens in plant material is an attractive technique for routine diagnostics in plant protection because it is cost-efficient, does not require any post-thermocycle sample processing, and allows multiplexing.

Supplementary Materials

The following materials are available online at https://www.mdpi.com/2076-0817/9/4/270/s1: Figure S1: Multiple sequence alignment of sRPB2 and sTEF-1α, Figure S2: Sampling sites of naturally Fusarium-infected maize ears across Germany, Table S1: Reference strains of Fusarium spp. used in this study, Table S2: Melting temperature and GC-content of sRPB2 and sTEF-1α amplicons of reference strains, Table S3: Species identification in naturally infected maize ears, Table S4: Melting temperature of sRPB2 and sTEF-1α amplicons of additional Fusarium species, Table S5 and Table S6: Target sequences checked for binding of newly designed primers.

Author Contributions

Conceptualization, S.S., L.B., M.V. and P.K.; methodology, S.S., L.B., M.V. and P.K.; software, S.S. and L.B.; validation, S.S., L.B., M.V., A.P., A.v.T. and P.K.; formal analysis, S.S., L.B. and P.K.; investigation, S.S., L.B., M.V., A.P., A.v.T. and P.K.; resources, A.v.T. and P.K.; data curation, S.S. and L.B.; writing—original draft preparation, S.S.; writing—review and editing, S.S., L.B., M.V., A.P., A.v.T. and P.K.; visualization, S.S. and L.B.; supervision, P.K.; project administration, A.v.T. and P.K.; funding acquisition, A.v.T. and P.K. All authors have read and agreed to the published version of the manuscript.

Funding

This research was funded by the German Federal Office for Agriculture and Food (BLE), grant number 2818208315, by the German Federal Ministry of Education and Research (BMBF) in the framework of the Bonares-SIGNAL project (funding codes: 031A562A and 031B0510A). We acknowledge support by the Open Access Publication Funds of the University of Goettingen.

Acknowledgments

The authors would like to thank Luciana Macis and Chelsea Schreiber for technical support and Bettina Tudzynski (University of Muenster, Germany), Susanne Vogelgsang (Agroscope, Switzerland), Tapani Yli-Mattila (University of Turku, Finland), and Jonathan Scauflaire (Earth and Life Institute, Louvain-la-Neuve, Belgium) for providing us with fungal strains.

Conflicts of Interest

The authors declare no conflict of interest. The funders had no role in the design of the study; in the collection, analyses, or interpretation of data; in the writing of the manuscript, or in the decision to publish the results.

References

  1. Xu, X.; Nicholson, P. Community ecology of fungal pathogens causing wheat head blight. Annu. Rev. Phytopathol. 2009, 47, 83–103. [Google Scholar] [CrossRef] [PubMed]
  2. D’Mello, J.P.F.; Placinta, C.M.; Macdonald, A.M.C. Fusarium mycotoxins: A review of global implications for animal health, welfare and productivity. Anim. Feed Sci. Technol. 1999, 80, 183–205. [Google Scholar] [CrossRef] [Green Version]
  3. Ferrigo, D.; Raiola, A.; Causin, R. Fusarium toxins in cereals: Occurrence, legislation, factors promoting the appearance and their management. Molecules 2016, 21, 627. [Google Scholar] [CrossRef] [PubMed] [Green Version]
  4. Duncan, K.E.; Howard, R.J. Biology of maize kernel infection by Fusarium verticillioides. Mol. Plant Microbe Interact. 2010, 23, 6–16. [Google Scholar] [CrossRef] [Green Version]
  5. Thompson, M.E.H.; Raizada, M.N. Fungal pathogens of maize gaining free passage along the silk road. Pathogens 2018, 7, 81. [Google Scholar] [CrossRef] [Green Version]
  6. Munkvold, G.P.; McGee, D.C.; Carlton, W.M. Importance of different pathways for maize kernel infection by Fusarium moniliforme. Phytopathology 1997, 87, 209–217. [Google Scholar] [CrossRef] [Green Version]
  7. Munkvold, G.P.; Carlton, W.M. Influence of inoculation method on systemic Fusarium moniliforme infection of maize plants grown from infected seeds. Plant Dis. 1997, 81, 211–216. [Google Scholar] [CrossRef] [Green Version]
  8. Murillo-Williams, A.; Munkvold, G.P. Systemic infection by Fusarium verticillioides in maize plants grown under three temperature regimes. Plant Dis. 2008, 92, 1695–1700. [Google Scholar] [CrossRef] [Green Version]
  9. Gai, X.; Dong, H.; Wang, S.; Liu, B.; Zhang, Z.; Li, X.; Gao, Z. Infection cycle of maize stalk rot and ear rot caused by Fusarium verticillioides. PLoS ONE 2018, 13, 7. [Google Scholar] [CrossRef]
  10. Alheeti, A.; Caldwell, R.; Smalley, E. Pathogenicity of Fusarium tricinctum, Fusarium poae and Fusarium sporotrichioides in maize ears. Phytopathology 1984, 74, 868. [Google Scholar]
  11. Logrieco, A.; Mulè, G.; Moretti, A.; Bottalico, A. Toxigenic Fusarium species and mycotoxins associated with maize ear rot in Europe. Eur. J. Plant Pathol. 2002, 108, 597–609. [Google Scholar] [CrossRef]
  12. Munkvold, G.P. Epidemiology of Fusarium diseases and their mycotoxins in maize ears. Eur. J. Plant Pathol. 2003, 109, 705–713. [Google Scholar] [CrossRef]
  13. Scauflaire, J.; Gourgue, M.; Munaut, F. Fusarium temperatum sp. nov. from maize, an emergent species closely related to Fusarium subglutinans. Mycologia 2011, 103, 586–597. [Google Scholar] [CrossRef] [PubMed] [Green Version]
  14. Czembor, E.; Stępień, Ł.; Waśkiewicz, A. Effect of environmental factors on Fusarium species and associated mycotoxins in maize grain grown in Poland. PLoS ONE 2015, 10, 7. [Google Scholar] [CrossRef]
  15. Fallahi, M.; Saremi, H.; Javan-Nikkhah, M.; Somma, S.; Haidukowski, M.; Logrieco, A.F.; Moretti, A. Isolation, molecular identification and mycotoxin profile of Fusarium species isolated from maize kernels in Iran. Toxins (Basel). 2019, 11, 297. [Google Scholar] [CrossRef] [Green Version]
  16. Busman, M.; Desjardins, A.E.; Proctor, R.H. Analysis of fumonisin contamination and the presence of Fusarium in wheat with kernel black point disease in the United States. Food Addit. Contam. - Part A Chem. Anal. Control. Expo. Risk Assess. 2012, 29, 1092–1100. [Google Scholar] [CrossRef]
  17. Amato, B.; Pfohl, K.; Tonti, S.; Nipoti, P.; Dastjerdi, R.; Pisi, A.; Karlovsky, P.; Prodi, A.; Chiara, M.; Fanelli, F.; et al. Fusarium proliferatum and fumonisin B1 co-occur with Fusarium species causing Fusarium head blight in durum wheat in Italy. J. Appl. Bot. Food Qual. 2015, 88, 228–233. [Google Scholar]
  18. von Bargen, S.; Martinez, O.; Schadock, I.; Eisold, A.M.; Gossmann, M.; Büttner, C. Genetic variability of phytopathogenic Fusarium proliferatum associated with crown rot in asparagus officinalis. J. Phytopathol. 2009, 157, 446–456. [Google Scholar] [CrossRef]
  19. Dastjerdi, R.; Karlovsky, P. Systemic infection of maize, sorghum, rice, and beet seedlings with fumonisin-producing and nonproducing Fusarium verticillioides strains. Plant Pathol. J. 2015, 31, 334–342. [Google Scholar] [CrossRef] [Green Version]
  20. Dastjerdi, R. High fumonisin content in maize: search for source of infection and biological function. Ph.D. thesis. 2014. Available online: https//ediss.uni-goettingen.de/handle/11858/00-1735-0000-0022-5EC0-E (accessed on 29 February 2020).
  21. Sobek, E.A.; Munkvold, G.P. European corn borer (Lepidoptera: Pyralidae) larvae as vectors of Fusarium moniliforme, causing kernel rot and symptomless infection of maize kernels. J. Econ. Entomol. 1999, 92, 503–509. [Google Scholar] [CrossRef]
  22. Kurtz, B.; Karlovsky, P.; Vidal, S. Interaction between western corn rootworm (Coleoptera: Chrysomelidae) larvae and root-infecting Fusarium verticillioides. Environ. Entomol. 2010, 39, 1532–1538. [Google Scholar] [CrossRef] [PubMed] [Green Version]
  23. Leslie, J.F.; Summerell, B.A. The Fusarium Laboratory Manual; Department of Plant Pathology, Kansas State University: Manhattan, NY, USA; Blackwell Publishing Professional: Ames, IA, USA, 2006; ISBN 9780813819198. [Google Scholar] [CrossRef]
  24. Hsieh, W.H. Mating Groups in Fusarium moniliforme. Phytopathology 1977, 77, 1041. [Google Scholar] [CrossRef] [Green Version]
  25. Kerényi, Z.; Zeller, K.; Hornok, L.; Leslie, J.F. Molecular standardization of mating type terminology in the Gibberella fujikuroi species complex. Appl. Environ. Microbiol. 1999, 65, 4071–4076. [Google Scholar] [CrossRef] [Green Version]
  26. Watanabe, M.; Yonezawa, T.; Lee, K.; Kumagai, S.; Sugita-Konishi, Y.; Goto, K.; Hara-Kudo, Y. Molecular phylogeny of the higher and lower taxonomy of the Fusarium genus and differences in the evolutionary histories of multiple genes. BMC Evol. Biol. 2011, 11, 322. [Google Scholar] [CrossRef] [PubMed] [Green Version]
  27. Kristensen, R.; Berdal, K.G.; Holst-Jensen, A. Simultaneous detection and identification of trichothecene- and moniliformin-producing Fusarium species based on multiplex SNP analysis. J. Appl. Microbiol. 2007, 102, 1071–1081. [Google Scholar] [CrossRef]
  28. O’Donnell, K.; McCormick, S.P.; Busman, M.; Proctor, R.H.; Ward, T.J.; Doehring, G.; Geiser, D.M.; Alberts, J.F.; Rheeder, J.P. Marasas et al. 1984 “Toxigenic Fusarium Species: Identity and mycotoxicology” revisited. Mycologia 2018, 110, 1058–1080. [Google Scholar]
  29. Thrane, U.; Hansen, U. Chemical and physiological characterization of taxa in the Fusarium sambucinum complex. Mycopathologia 1995, 129, 183–190. [Google Scholar] [CrossRef]
  30. Zainudin, N.A.I.; Razak, A.A.; Salleh, B. Secondary metabolite profiles and mating populations of Fusarium species in section Liseola associated with bakanae disease of rice. Malays. J. Microbiol. 2008, 4, 6–13. [Google Scholar]
  31. Nutz, S.; Döll, K.; Karlovsky, P. Determination of the LOQ in real-time PCR by receiver operating characteristic curve analysis: Application to qPCR assays for Fusarium verticillioides and F. proliferatum. Anal. Bioanal. Chem. 2011, 401, 717–726. [Google Scholar] [CrossRef] [Green Version]
  32. Aoki, T.; O’Donnell, K.; Geiser, D.M. Systematics of key phytopathogenic Fusarium species: Current status and future challenges. J. Gen. Plant Pathol. 2014, 80, 189–201. [Google Scholar] [CrossRef]
  33. Nicholson, P.; Simpson, D.R.; Weston, G.; Rezanoor, H.N.; Lees, A.K.; Parry, D.W.; Joyce, D. Detection and quantification of Fusarium culmorum and Fusarium graminearum in cereals using PCR assays. Physiol. Mol. Plant Pathol. 1998, 53, 17–37. [Google Scholar] [CrossRef]
  34. Turner, A.S.; Lees, A.K.; Rezanoor, H.N.; Nicholson, P. Refinement of PCR-detection of Fusarium avenaceum and evidence from DNA marker studies for phenetic relatedness to Fusarium tricinctum. Plant Pathol. 1998, 47, 278–288. [Google Scholar] [CrossRef]
  35. Wilson, A.; Simpson, D.; Chandler, E.; Jennings, P.; Nicholson, P. Development of PCR assays for the detection and differentiation of Fusarium sporotrichioides and Fusarium langsethiae. FEMS Microbiol. Lett. 2004, 233, 69–76. [Google Scholar] [CrossRef] [PubMed] [Green Version]
  36. Waalwijk, C.; Van Der Heide, R.; De Vries, I.; Van Der Lee, T.; Schoen, C.; Costrel-de Corainville, G.; Häuser-Hahn, I.; Kastelein, P.; Köhl, J.; Lonnet, P.; et al. Quantitative detection of Fusarium species in wheat using TaqMan. Eur. J. Plant Pathol. 2004, 110, 481–494. [Google Scholar] [CrossRef]
  37. Brandfass, C.; Karlovsky, P. Upscaled CTAB-based DNA extraction and real-time PCR assays for Fusarium culmorum and F. graminearum DNA in plant material with reduced sampling error. Int. J. Mol. Sci. 2008, 9, 2306–2321. [Google Scholar] [CrossRef] [PubMed] [Green Version]
  38. Scauflaire, J.; Godet, M.; Gourgue, M.; Liénard, C.; Munaut, F. A multiplex real-time PCR method using hybridization probes for the detection and the quantification of Fusarium proliferatum, F. subglutinans, F. temperatum, and F. verticillioides. Fungal Biol. 2012, 116, 1073–1080. [Google Scholar] [CrossRef]
  39. Stakheev, A.A.; Khairulina, D.R.; Riazantsev, D.I.; Zavriev, S.K. Phosphate permease gene as a marker for the specific identification of toxigenic fungus Fusarium cerealis. Russ. J. Bioorganic Chem. 2013, 39, 175–183. [Google Scholar] [CrossRef]
  40. Gräfenhan, T.; Schroers, H.J.; Nirenberg, H.I.; Seifert, K.A. An overview of the taxonomy, phylogeny, and typification of nectriaceous fungi in Cosmospora, Acremonium, Fusarium, Stilbella, and Volutella. Stud. Mycol. 2011, 68, 79–113. [Google Scholar] [CrossRef] [Green Version]
  41. Moussa, T.A.A.; Al-Zahrani, H.S.; Kadasa, N.M.S.; Ahmed, S.A.; de Hoog, G.S.; Al-Hatmi, A.M.S. Two new species of the Fusarium fujikuroi species complex isolated from the natural environment. Antonie van Leeuwenhoek, Int. J. Gen. Mol. Microbiol. 2017, 110, 819–832. [Google Scholar] [CrossRef] [Green Version]
  42. Słomka, M.; Sobalska-Kwapis, M.; Wachulec, M.; Bartosz, G.; Strapagiel, D. High resolution melting (HRM) for high-throughput genotyping—limitations and caveats in practical case studies. Int. J. Mol. Sci. 2017, 18, 2316. [Google Scholar] [CrossRef] [Green Version]
  43. Mao, F.; Leung, W.Y.; Xin, X. Characterization of EvaGreen and the implication of its physicochemical properties for qPCR applications. BMC Biotechnol. 2007, 7, 76. [Google Scholar] [CrossRef] [Green Version]
  44. Garritano, S.; Gemignani, F.; Voegele, C.; Nguyen-Dumont, T.; Le Calvez-Kelm, F.; De Silva, D.; Lesueur, F.; Landi, S.; Tavtigian, S.V. Determining the effectiveness of high resolution melting analysis for SNP genotyping and mutation scanning at the TP53 locus. BMC Genet. 2009, 10, 5. [Google Scholar] [CrossRef] [PubMed] [Green Version]
  45. Gelaye, E.; Mach, L.; Kolodziejek, J.; Grabherr, R.; Loitsch, A.; Achenbach, J.E.; Nowotny, N.; Diallo, A.; Lamien, C.E. A novel HRM assay for the simultaneous detection and differentiation of eight poxviruses of medical and veterinary importance. Sci. Rep. 2017, 7, 42892. [Google Scholar] [CrossRef] [PubMed] [Green Version]
  46. Solano, J.; Anabalón, L.; Encina, F.; Esse, C.; Penneckamp, D. Hybrid identification in Nothofagus subgenus using high resolution melting with ITS and trnL approach. PeerJ 2019, 7, e6779. [Google Scholar] [CrossRef] [PubMed] [Green Version]
  47. Chabi, J.; Van’t Hof, A.; N’dri, L.K.; Datsomor, A.; Okyere, D.; Njoroge, H.; Pipini, D.; Hadi, M.P.; De Souza, D.K.; Suzuki, T.; et al. Rapid high throughput SYBR green assay for identifying the malaria vectors Anopheles arabiensis, Anopheles coluzzii and Anopheles gambiae s.s. Giles. PLoS ONE 2019, 14, 4. [Google Scholar] [CrossRef] [Green Version]
  48. Brandfass, C.; Karlovsky, P. Simultaneous detection of Fusarium culmorum and F. graminearum in plant material by duplex PCR with melting curve analysis. BMC Microbiol. 2006, 6, 4. [Google Scholar] [CrossRef] [Green Version]
  49. Ganopoulos, I.; Madesis, P.; Zambounis, A.; Tsaftaris, A. High-resolution melting analysis allowed fast and accurate closed-tube genotyping of Fusarium oxysporum formae speciales complex. FEMS Microbiol. Lett. 2012, 334, 16–21. [Google Scholar] [CrossRef]
  50. Pfordt, A.; Ramos Romero, L.; Schiwek, S.; Karlovsky, P.; von Tiedemann, A. Impact of environmental conditions and agronomic practices on the prevalence of Fusarium species associated with ear- and stalk rot in maize. Pathogens 2020, 9, 236. [Google Scholar] [CrossRef] [Green Version]
  51. Lu, S.; Mirchevska, G.; Phatak, S.S.; Li, D.; Luka, J.; Calderone, R.A.; Fonzi, W.A. Dynamic time warping assessment of high-resolution melt curves provides a robust metric for fungal identification. PLoS ONE 2017, 12, e0173320. [Google Scholar] [CrossRef] [Green Version]
  52. Papavasileiou, A.; Madesis, P.; Karaoglanidis, G. Identification and differentiation of Monilinia species causing brown rot of pome and stone fruit using high-resolution melting (HRM) analysis. Phytopathology 2016, 106, 1055–1064. [Google Scholar] [CrossRef] [Green Version]
  53. Perrone, G.; Bottalico, A. Toxigenic Fusarium species and mycotoxins associated with head blight in small-grain cereals in Europe. Eur. J. Plant Pathol. 2002, 108, 611–624. [Google Scholar]
  54. Zhang, N.; Geiser, D.M.; Smart, C.D. Macroarray detection of solanaceous plant pathogens in the Fusarium solani species complex. Plant Dis. 2007, 91, 1612–1620. [Google Scholar] [CrossRef] [PubMed] [Green Version]
  55. Tambong, J.T.; De Cock, A.W.A.M.; Tinker, N.A.; Lévesque, C.A. Oligonucleotide array for identification and detection of Pythium species. Appl. Environ. Microbiol. 2006, 72, 2691–2706. [Google Scholar] [CrossRef] [PubMed] [Green Version]
  56. van Doorn, R.; Szemes, M.; Bonants, P.; Kowalchuk, G.A.; Salles, J.F.; Ortenberg, E.; Schoen, C.D. Quantitative multiplex detection of plant pathogens using a novel ligation probe-based system coupled with universal, high-throughput real-time PCR on OpenArraysTM. BMC Genomics 2007, 8, 276. [Google Scholar] [CrossRef] [PubMed] [Green Version]
  57. Liu, Y.J.; Whelen, S.; Hall, B.D. Phylogenetic relationships among ascomycetes: Evidence from an RNA polymerse II subunit. Mol. Biol. Evol. 1999, 16, 1799–1808. [Google Scholar] [CrossRef]
  58. Stielow, J.B.; Lévesque, C.A.; Seifert, K.A.; Meyer, W.; Irinyi, L.; Smits, D.; Renfurm, R.; Verkley, G.J.M.; Groenewald, M.; Chaduli, D.; et al. One fungus, which genes? Development and assessment of universal primers for potential secondary fungal DNA barcodes. Persoonia Mol. Phylogeny Evol. Fungi 2015, 35, 242–263. [Google Scholar] [CrossRef] [PubMed] [Green Version]
  59. Lofgren, L.A.; LeBlanc, N.R.; Certano, A.K.; Nachtigall, J.; LaBine, K.M.; Riddle, J.; Broz, K.; Dong, Y.; Bethan, B.; Kafer, C.W.; et al. Fusarium graminearum: pathogen or endophyte of North American grasses? New Phytol. 2018, 217, 1203–1212. [Google Scholar] [CrossRef] [Green Version]
  60. O’Donnell, K.; Kistler, H.C.; Cigelnik, E.; Ploetz, R.C. Multiple evolutionary origins of the fungus causing Panama disease of banana: concordant evidence from nuclear and mitochondrial gene genealogies. Proc. Natl. Acad. Sci. USA 1998, 95, 2044–2049. [Google Scholar] [CrossRef] [Green Version]
  61. Thompson, J.D.; Higgins, D.G.; Gibson, T.J. CLUSTAL W: Improving the sensitivity of progressive multiple sequence alignment through sequence weighting, position-specific gap penalties and weight matrix choice. Nucleic Acids Res. 1994, 22, 4673–4680. [Google Scholar] [CrossRef] [Green Version]
  62. Kumar, S.; Stecher, G.; Tamura, K. MEGA7: Molecular evolutionary genetics analysis version 7.0 for bigger datasets. Mol. Biol. Evol. 2016, 33, 1870–1874. [Google Scholar] [CrossRef] [Green Version]
  63. Notredame, C.; Higgins, D.G.; Heringa, J. T-coffee: A novel method for fast and accurate multiple sequence alignment. J. Mol. Biol. 2000, 302, 205–217. [Google Scholar] [CrossRef] [PubMed] [Green Version]
  64. Robert, X.; Gouet, P. Deciphering key features in protein structures with the new ENDscript server. Nucleic Acids Res. 2014, 42, 320–324. [Google Scholar] [CrossRef] [PubMed] [Green Version]
  65. R Core Team. R: A Language and Environment for Statistical Computing; R Foundation for Statistical Computing: Vienna, Austria, 2018; Available online: https://www.r-project.org/ (accessed on 10 March 2020).
Figure 1. Workflow of high-resolution melting (HRM) curve analysis of eight major Fusarium pathogens of maize ears. (A) Identification of Fusarium species in infected maize ear samples; (B) identification or pure cultures using fungal colony PCR. sRPB2 and sTEF-1α are short and variable subsections of RPB2 and TEF-1α, suitable for HRM analysis (Table 1). Fusarium species in brackets were not well distinguishable using the sRPB2 assay.
Pathogens 09 00270 g001
Figure 2. Maximum likelihood analysis of the DNA sequences used for HRM analysis. (A) sRPB2 sequences (1000 bootstrap replications) (B) sTEF-1α (without bootstrapping due to a low number of sequences (n = 3)). We included partial sequences of RPB2 of Trichoderma istrianum CBS130539 (Accession KJ665281.1) and TEF-1α of F. pseudograminearum CBS131261 (Accession JX118971.1) as outgroup references. Melting curves using normalized relative fluorescence unit (RFU) data of sRPB2 (C) and sTEF-1α (D). Melting curves were generated as negative first derivative (−d(RFU)/d(T)) of relative fluorescence. Difference curves of the reference strains and a naturally infected maize ear for sRPB2 (E) and sTEF-1α (F) are shown. The difference curves were obtained by subtracting melting curve data of each reference strain or environmental sample from the mean melting curves of all reference strains (dashed horizontal line). Vertical dashed lines indicate the maximum and minimum for each reference strain. sRPB2 and sTEF-1α are short subsections of RPB2 and TEF-1α (Table 1).
Pathogens 09 00270 g002
Figure 3. Fungal colony PCR followed by high-resolution melting (HRM) curve analysis of (A) sRPB2 and (B) sTEF-1α. Difference curves were obtained by subtracting melting curves of each reference strain from the mean melting curve data of all reference strains (dashed horizontal line). Vertical dashed lines indicate the maximum and minimum of the curve for each reference strain. sRPB2 and sTEF-1α are short subsections of RPB2 and TEF-1α (Table 1).
Pathogens 09 00270 g003
Table 1. Primers used in this study.
NameSequence (5‘–3‘)GeneAmplicon Length (bp)Reference
RPB2-5F2GGGGWGAYCAGAAGAAGGCRPB21200[59]
RPB2-7CRCCCATRGCTTGYTTRCCCAT
EF1αFATGGGTAAGGARGACAAGACTEF-1α694[60]
EF1αRGGARGTACCAGTRATCATGTT
RPB2-5R1sTCAACVACTTCCATACCTCsRPB2 *304 (with RPB2-5F2)This study
TEF-1aFs2CAATAGGAAGCCGCYGAGsTEF-1α *247 (with EF1αR)This study
* Short and variable subsections of RPB2 and TEF-1α, which were selected for high-resolution melting (HRM) curve analysis.

